
Landslides pose a threat to infrastructure and public safety and can induce large-scale ecological change. Although landslides in British Columbia have been attributed to climatic factors, such as extreme weather events, degrading mountain permafrost and glacial debuttressing, there are relatively few reports in British Columbia of regional-scale landslides triggered by Earthquakes. Yet, co-seismic landslides (i.e. landslides which coincide with seismic events) are well-documented in other Earthquake-prone areas around the world, including New Zealand, China, Japan, Nepal, California, and Alaska. An Earthquake can directly trigger numerous landslides and, as well, reduce soil and rock strength such that rainfall initiates instability in the months and years following the earthquake. Haida Gwaii, an archipelago located in the northeast Pacific Ocean about 50 km west of mainland British Columbia, is prone to heavy rainfall, strong Earthquakes, and frequent landslides. On 27 October 2012 a Magnitude 7.8 Earthquake, the second largest instrumentally recorded Earthquake in Canada, occurred approximately 20 km off the coast of Haida Gwaii at a depth of 23 km. The event was recorded on seismographs across North America and much of the world, and notably on strong motion instruments in Masset, the village of Queen Charlotte where a peak horizontal acceleration of 0.2 g was recorded, as well as in Prince Rupert on the adjacent mainland. The Earthquake occurred on an unnamed subduction interface beneath the Queen Charlotte Fault, a boundary between the Pacific and North America plates. The fault slipped over an area of about 120 × 50 km. Thousands of aftershocks followed the event, the largest a Magnitude 6.3 event on 28 October 2012, and another Magnitude 6.1 event on 29 October 2012.
In a paper published in the journal Landslides on 9 November 2019, Sophia Barth of the British Columbia Ministry of Forests, Lands, Natural Resource Operations, and Rural Development, and the Universität Potsdam, Marten Geertsema amd Alexandre Bevington, also of the British Columbia Ministry of Forests, Lands, Natural Resource Operations, and Rural Development, and of the Natural Resources and Environmental Studies Institute and Geography Program at the University of Northern British Columbia, Alison Bird of the Geological Survey of Canada, John Clague of the Department of Earth Sciences at Simon Fraser University, Tom Millard, again of the British Columbia Ministry of Forests, Lands, Natural Resource Operations, and Rural Development, Peter Bobrowsky, also of the Geological Survey of Canada, Andreas Hasler of SensAlpin, and Hongjiang Liu of the Yunan University of Finance and Economics, present the results of a study which aimed to compare rates and characteristics of landslides before and after the 27 October 2012 Haida Gwaii Earthquake with pre-event baseline landslide inventory data.

Location map of the study area on Haida Gwaii (formerly the Queen Charlotte Islands). Note the Queen Charlotte Fault (dashed line), Environment Canada weather stations, and the main population centres. Earthquakes between 27 October and 27 November 2012 are shown as grey circles if smaller than Magnitude 6.0 and as stars if larger than Magnitude 6.0. Barth et al. (2019).
The study area covers 1350 km² in Gwaii Haanas National Park Reserve and Haida Heritage Site, which includes the southern part of Moresby Island and numerous adjacent smaller islands. This part of the archipelago lies entirely within the Queen Charlotte Ranges and is characterized by moderate to high relief with peaks ranging in elevation from 1000 m above sealevel in the north to 400–500 m above sealevel in the south.
The bedrock of the study area comprises Triassic basalts of the Karmutsen Formation intruded by Jurassic granitic plutons that form the higher elevation mountains. Lyell Island, a large island in the northeast corner of the study area, is part of the Tertiary Masset Formation consisting of basalts and rhyolites. Sedimentary rocks of Late Triassic to Cretaceous age occur in the north.
The study area is dominated by Coniferous forest; the dominant tree species are Western Hemlock, Tsuga heterophylla, Sitk Spruce, Picea engelmannii, and at higher elevations Mountain Hemlock, Tsuga mertensiana. The highest peaks support herbaceous alpine vegetation. The most common soil types are podzols (the typical soils of coniferous or boreal forests), regosols (very weakly developed mineral soils, extensive in eroding lands), and organic soils (soils that contains significant amounts of organic material). Coastal British Columbia, including Haida Gwaii, is known for its upland organic soils that are commonly associated with debris slide initiation zones.
Haida Gwaii has a cool temperate, humid to perhumid (having no annual shortage of rain), oceanic climate. The temperate climate of the archipelago is influenced by its location in the northeast Pacific Ocean distant from the North American mainland. Temperatures differ little between seasons and rarely fall below 0 °C at low elevations. The dominantly humid climate is, however, strongly influenced by topography. The east coast is much drier than the west coast as it is shielded from humid North Pacific air masses by the Queen Charlotte Ranges, and the higher elevations occasionally support intermittent snow.
Three Environment Canada weather stations are near the study area. Climate normals were derived from the Sandspit A, a weather station near sea level, based on the years 1981–2010. The mean annual air temperature at Sandspit A is 8.6 °C. The coldest month is January, with an average temperature of 4 °C. August is the warmest month, with temperatures averaging 15.2 °C. Mean annual precipitation at the Sandspit A station is 1408 mm, of which an average of 1371 mm falls as rain. About 78% of the annual precipitation falls between October and April. December is the wettest month, with an average of 196 mm of precipitation. July, the driest month, has an average of 48 mm of rain. Strong prevailing winds, mostly from the southwest, are common on Haida Gwaii. The average wind speed measured at Sandspit A is 19.3 km/h, and the maximum wind gust speed, recorded in 1974, was 164 km/h. A 5-year return interval is estimated for storms of similar severity to the 1974 event. Modelled, mean annual precipitation of Haida Gwaii for the period 1961–1990 showed that a large portion of our study area, some 50–150 km from the Sandspit A station, experiences 3000–5000 mm mean annual precipitation.
Haida Gwaii is the most seismically active region in Canada. The dominantly transform Queen Charlotte Fault extends along the full length of the archipelago directly off its western margin. The relative plate motion, about 50 mm/year, is about 15° to 20° oblique to the strike of the fault off Moresby Island. Consequently, there is a component of convergence and compression across this part of the plate boundary accommodated by thrust earthquakes; the 2012 Earthquake was such an event.
Small and moderate Earthquakes around Haida Gwaii were not well recorded before a local seismic network was established in the mid-1980s. Several large Earthquakes were recorded by the regional network in the preceding decades, including a magnitude 8.1 event in 1949, the largest instrumentally recorded earthquake in Canada’s history. The seismic network installed on the islands and adjacent mainland has revealed high levels of seismicity off the archipelago’s west coast, and considerable activity inland, notably on Graham Island and in northern Hecate Strait.
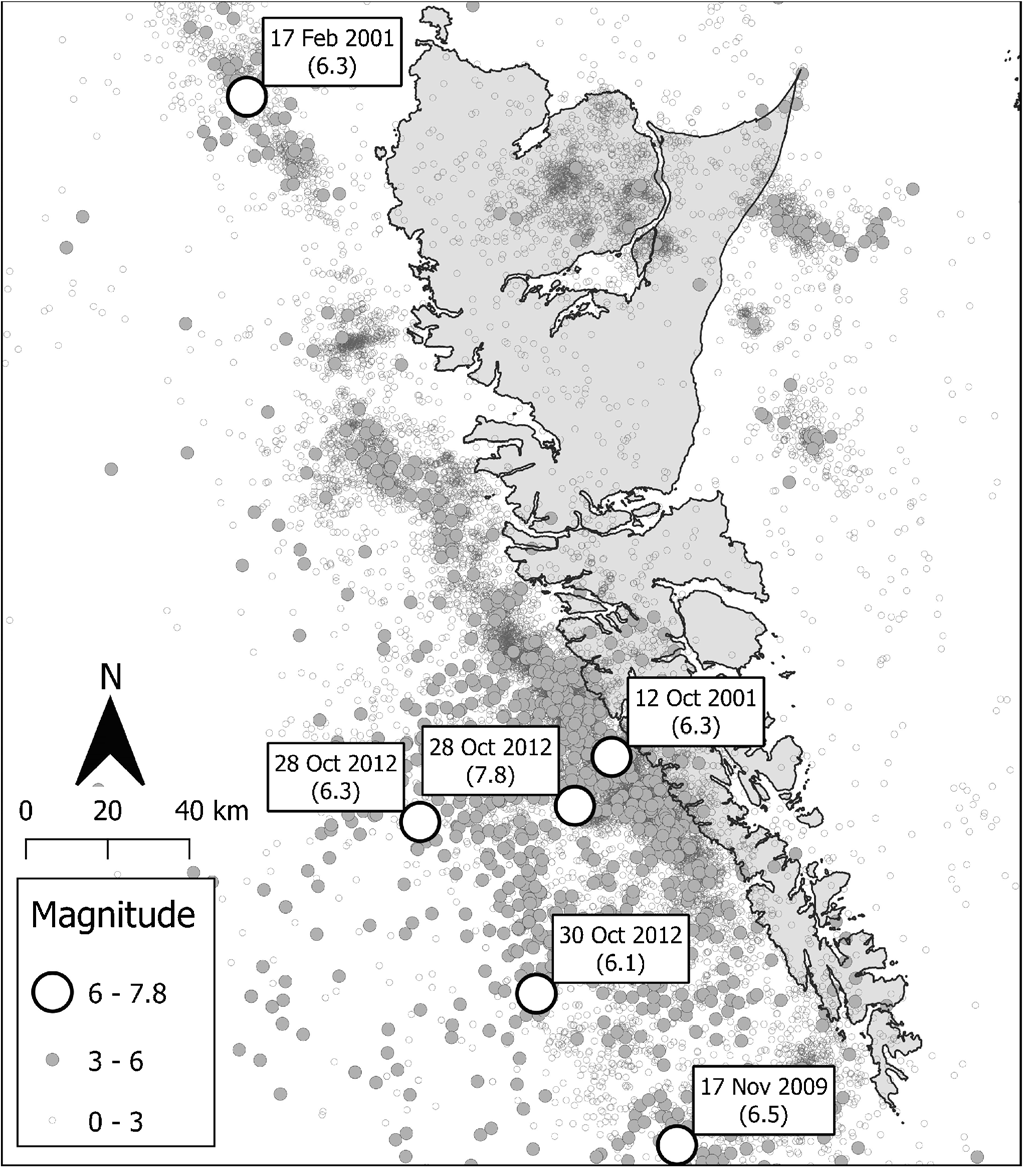
Spatial distribution of Earthquakes on and near Haida Gwaii. The first Earthquake included in this compilation is 1 January 1985 and the last is 10 January 2019. The date and magnitude of earthquakes stronger than Magnitude 6.0 are shown on the map. Barth et al. (2019).
Many landslide inventories have been made on Haida Gwaii since the early 1980s. Most of these focused on landscapes subject to forest harvesting, particularly in the north, and were a response to concerns over possible impacts on fish habitats. In contrast, Barth et al.'s study is within parks and protected areas, and concerns only landslides in forested terrain that has not been subject to road building or timber harvesting.
Most of the landslides in past inventories are debris slides (fast-moving landslides made up of liquefied, unconsolidated, and saturated mass that resembles flowing concrete), debris flows (moving masses of loose mud, sand, soil, rock, water and air), and rock slides (landslides caused by rock failure), in order of decreasing abundance.
Barth et al. used photographs taken during aerial reconnaissance flights, high-resolution aerial photos, and satellite images to map landslides. Aerial overview flights were made by helicopter on 7 and 8 November 2012 and by fixed-wing plane on 12 November 2012. The 12 November flight covered most of the study area, whereas the earlier flight was at the north end of the area. The two flights constrain the time of fresh landslides to shortly after the Earthquake, but before the first cloud-free satellite images were acquired. Barth et al. photographed all landslides that they saw during the reconnaissance flights and recorded their locations on the flight GPS tracks.

Fresh debris slides south of Gowaia Bay, photographed on 12 November 2012, 16 days after the Earthquake. Scale shown pertains to the image foreground. Marten Geertsema in Barth et al. (2019).
Barth et al. created landslide polygons by interpreting 2007 aerial photographs and high-resolution RapidEye and PlanetScope satellite images. The most recent pre-Earthquake air photos date from 2007. Satellite imagery also exists; however, the air photos offer a much higher spatial resolution. Barth et al. also used cloud-free satellite images from 2012, 2013, and 2016 acquired by the RapidEye (5 m resolution) satellite constellation and from 2018 acquired by the PlanetScope Dove (3 m resolution) constellation. Both include visible and nearinfrared spectral bands that assist in landscape interpretation.
Barth et al. manually digitized landslide polygons from the available imagery. They assumed that no mapped landslide in the earliest image (2007) experiences a full ecological recovery in the subsequent imagery. Previous studies have observed that landslides on upper slopes of volcanic bedrock on Haida Gwaii require 40 years to become about 50% revegetated, although revegetation would be more rapid on lower slope positions and on other substrates.
The imagery Barth et al. used to determine average annual landslide rates and distribution in the study area over a period of almost 11 years is limited by several factors, including cloud cover, snow, shadows, and image resolution. Frequent cloud cover led to the exclusion of some images. In a few instances, Barth et al. had to use coarser satellite images to patch holes in their imagery and complete the inventory. Although snow on Haida Gwaii tends to accumulate only at high elevations, above where most landslides occur, it is possible that some landslides were hidden by snow. Furthermore, shadows on steep mountainous slopes and the forest canopy can obscure small landslides. Due to the spatial resolution of the post-earthquake imagery, the detection of small landslides was challenging.
Barth et al. delimited landslide polygons on the 2013 imagery and examined older images to detect landslides older than the 2012 earthquake. To obtain a better understanding of the frequency of landslides after the Earthquake, they extended the inventory to 2018 and drew polygons on the 2016 and 2018 images. Barth et al. mapped vindividual landslides and landslide complexes. They classified landslides with one headscarp, but two or more slide paths as single landslides. Landslides with several distinct headscarps and slide paths that coalesced were counted as multiple landslides. Barth et al.summed and averaged the number and area of these polygons to determine the normalized yearly number and size of the landslides from 2007 to 2018. They categorized all landslides that happened within the decade by type.

(a) Map showing aerial reconnaissance flight track and locations of pre- and post-Earthquake landslides. (b), (c) Inset images (locations shown in a), providing details of pre- and post-Earthquake landslides overlain on 2017 summer SPOT 6/7 satellite imagery. Barth et al. (2019).
Barth et al. identified and mapped 446 landslide polygons in their 1350 km² study area; 95% were classified as debris slides and 5% as debris flows. The areas of the smallest, the average, and the largest detected landslide were 890 m², 19 000 m², and 243 000 m², respectively. A few rockslides were observed north of the study area following the 2012 Earthquake, but none were found within the studt area. Many of the landslides initiated in Folisols directly below hill crests.
Barth et al. mapped 97 landslides for the pre-Earthquake period (2007–2012), yielding an annual rate of 1.44 landslides per 100 km²/year, which represents 19.4 landslides per year. The total annual landslide area for that period is 0.35 km², with an average pre-Earthquake landslide area of 3500 m² (total area/count) for this period.
Barth et al. mapped 244 landslides between September 2012 (pre-earthquake) and May 2013 (post-earthquake). They consider them to be seismically induced, probably co-seismic (having occurred at the same time as the Earthquake), landslides based on observations made during our overview flights and eyewitness accounts on northern Haida Gwaii. The calculated frequency of post-earthquake landslides is 18.1 landslides per 100 km²/year, representing a 12.9-fold increase over the previous annual landslide rate and a 65.8-fold increase in annual landslide area per 100 km²/year. Average landslide size increased from 3600 m² to 18 800 ha m².
After this spike, the rates and numbers of landslides decreased. In the next three years (2013–2016), Barth et al. identified an additional 78 landslides, and in the following two years (2016–2018), they recognized another 27 Between May 2013 and May 2016, Barth et al. identified an average of 26 landslides per year, and between 2016 and 2018, the number decreased further to 13.5 landslides per year. nnual landslide rates per 100 km² are, respectively, 1.93 and 1.0 for the two periods. The average size of the post-Earthquake landslides, however, is lower for the 2013–2016 period (5900 m²) than for the 2016–2018 period (12 200 m²).
Prior to 2012, most of the area covered by landslides occurred on slopes facing west (14%), southwest (20%), and south (25%), whereas 11%, 7%, and 11% occurred on, respectively, northwest-, north-, and northeast-facing slopes, and only 6% and 7% occurred on east and southeast facing slopes. In contrast up to 20%, 17%, and 12% of landslides in 2012–2013 occurred on northwest-, north-, and southeast-facing slopes. In the 6 years following the earthquake, only 6.8% of landslide area occurred on northwest-facing slopes, and the slope aspect distribution resembles the pre-earthquake conditions.
The Sandspit A climate station experienced 49 mm of precipitation on 15 October 2012, a few days before the Earthquake. Precipitation recorded during the months following the earthquake was normal, and precipitation during November of that year was 31 mm, near the average value. The Cape St James station recorded 66 mm of rainfall on 22 February 2013, 4 months after the earthquake, but some precipitation data for this station in the months following the Earthquake are missing.
On 4 November 2012, a storm with southwest winds up to 120 km/h was recorded at Cape St. James. On the same day, southeast winds with a maximum speed of 124 km/h were measured at the Cumshewa weather station north of Gwaii Haanas. One day earlier, even higher southerly gusts of 139 km/h were recorded at the Cumshewa station.
Storms with heavy rainfall occur frequently on the west coast of Haida Gwaii. The Cumshewa Island station recorded several severe storms during the period of this study. For example, storms with maximum wind gust speeds of 130 km/h and 128 km/h occurred, respectively, in March 2008 and December 2015. In one day in January 2016, 74 mm of rain fell at the Cumshewa Island weather station, and in October 2009 nearly 80 mm of rain fell at that station within 24 h.
There was a notable spike in landslides after the 2012 Haida Gwaii Earthquake. Of the 446 landslides that Barth et al. identified between 2007 and 2018, 244 were seismically induced and probably co-seismic. More than 100 were validated during reconnaissance flights in 2012, less than 2 weeks after the earthquake, along with some eyewitness accounts of co-seismic landslides north of the study area.
The spike in landslides triggered by the Earthquake represents a 12.9-fold increase in the number of landslides over the background rate. The same dataset expressed in terms of area yields a 65.8-fold increase in landslide area, from 0.07 km²/year to 4.6 km²/year. The average area of the 244 seismically induced landslides is 0.0188 km², which is about five times higher than the area of landslides prior to the earthquake.
There were no significant storms or periods of heavy rainfall at the time of, or shortly after, the earthquake that might account for the spike in landslides. This fact increases the significance and likelihood of them being earthquake-triggered.
Earthquake-induced landslide spikes have been reported in many regions of the world, although not associated with shallow Folisols. Barth et al.'s data shows that shallow organic Folisols on Canada’s west coast are susceptible to failure during strong Earthquakes.
The nearest seismometer to the study area (Barry Inlet on the west coast of Moresby Island) was damaged by the earthquake. The remaining weak-motion seismometers on Haida Gwaii were saturated by the strong shaking. Strong motion Internet Accelerometers, however, recorded the earthquake well and indicated a peak horizontal acceleration of 0.2 g at the Village of Queen Charlotte, 80 km from the epicentre. Ground accelerations within Gwaii Haanas Park would have exceeded 0.2 g (roughly 1.96 m/s²). Barth et al. note that people on Haida Gwaii reported very strong shaking more than 150 km from the epicentre.
Non-seismic landslides that happened before the earthquake were concentrated on south and southeast slopes, which face the prevailing storms and winds. In contrast, most of the earthquake-induced landslides face northwest. The Centroid Moment Tensor solution for the Earthquake indicates thrust displacements to the northeast, which would cause the overriding crust to shift to the southwest. GPS measurements show that Moresby Island moved as much as 1.15 m to the southeast and subsided by as much as 0.3 m during the Earthquake. This movement may have produced instantaneous increases in pore pressure in watersaturated Folisols on the north-facing slopes that historically experience less failure.

Oblique view of Haida Gwaii landslides just south of Gowaia Bay. For the entire study area some 39% of the Earthquake-induced landslide area (red) occurred on north-facing slopes, in the lee of prevailing weather systems. In comparison, less than 34% of the area of pre Earthquake, nonseismic landslides (white pre 1952, purple pre 1984, pink pre 1994, yellow pre 2007, green 2012) occurs on north-facing slopes. North arrow (white dashed line) is 2 km long. Barth et al. (2019).
Numerous previous studies have contrasted seismic from rain-induced landslides. Earthquake-induced landslides have affinities to faults and ridge crests, and in some cases to particular geological units. In contrast, rain-induced landslides commonly occur on lower slopes. In Barth et al.'s study, both rain- and seismically induced landslides initiated on upper slopes near ridge crests. This strong association with ridge crests may have something to do with the low strength of organic Folisols, which occupy these upper slopes.
Fewer studies have noted aspect relationships of Earthquake-induced landslides. The main difference between Barth et al.'s dataset and those of previous researchers is that many of our earthquake-induced landslides (37% north-northwest slopes) occurred on slopes with different aspects than those of rain-induced landslides (18% north-northwest slopes). Previous studies have found that co-seismically triggered landslides tended to occur on slopes facing away from the earthquake epicentre. In contrast, a disproportionately large number of the coseismic Haida Gwaii landslides occurred on slopes facing the epicentre. This may have more to do with the Earthquake’s rupture mechanism influencing directivity of ground motion and hence affected slope aspects than simple epicentral direction.
Barth et al. document an order-of-magnitude increase in the number of debris slides and debris flows during and shortly after the Haida Gwaii earthquake of 27 October 2012. The number of landslides increased 12.9 times and the area of landslides increased 65.8 times immediately after the Earthquake. Average landslide area increased from 0.07 km² per year to 4.6 km² per year, and the average size of landslides increased from 3600 m²/y immediately before the earthquake to 18 800 m²/year afterwards. Landslide rates and sizes returned to near pre-2012 levels in the years after the Earthquake, although they remained slightly elevated.
Most non-seismically triggered landslides in the study area occur on south- and southwest-facing slopes in the direction of the prevailing winds and storms. In contrast, some 32% of the seismically induced landslides occurred on north- and northwest-facing slopes, and 33% on south- and southeastfacing facing in the direction of the Earthquake epicentre. This contrasts with other studies that have shown a preference for landslides to face away from Earthquake epicentres. This may relate to the Earthquake’s rupture mechanism influencing directivity of ground motion.
See also...


Follow Sciency Thoughts on Facebook.